RAD: Reward-Aligned Distillation

Yilan Chen1,* Zian Su2,* Manish Prajapat3 Dingmin Wang3 Rui Song4 Rein Houthooft3 Vijay Lingam3

1 UC San Diego2 Purdue University3 AWS AI Labs4 Amazon

* Work done during an internship at AWS AI Labs.

The idea in three minutes

3:02 · Explainer video

From uniform teacher imitation to reward-guided token weights.

Download video

Abstract

Reinforcement learning with verifiable rewards improves the reasoning capabilities of large language models, but remains computationally expensive and sample inefficient. On-policy distillation (OPD) provides dense token-level supervision from a stronger teacher, yet standard OPD distills every token regardless of whether the teacher’s preference actually improves task reward. Existing token-selection methods rely on proxies such as uncertainty or teacher–student divergence, which need not identify reward-improving supervision. We introduce Reward-Aligned Distillation (RAD), a bilevel framework that weights distillation signals based on their predicted effect on the student’s post-update reward. RAD differentiates through a temporary optimizer step to score each token’s supervision, then updates the token weights by projected ascent from the initial token weights. The resulting weights can strengthen, suppress, or reverse individual distillation-gradient contributions. At a matched training-response budget, RAD improves mean accuracy on six competition-math benchmarks over the strongest baselines by 6.5 percentage points for Qwen3-1.7B (non-thinking) and 2.5 points for Qwen3-4B-Instruct-2507. RAD-Simple, a simplified variant, achieves comparable math accuracy at the same training-response budget. On LiveCodeBench-v6, RAD reaches 54.69% and 58.67% pass@1 with Qwen3-1.7B (non-thinking) and OLMo3-7B-Instruct, respectively, exceeding the strongest baselines by 8.7 and 6.4 points. These results support reward-guided weighting of teacher supervision across model families and tasks.

Read the full paper on arXiv

Which teacher signals actually improve reward?

On-policy distillation provides a learning signal at every token. RAD uses the student’s predicted post-update reward to decide how to weight that supervision.

The idea

Take a temporary student update. Measure each token’s reward sensitivity. Use those scores to strengthen, suppress, or reverse its distillation contribution.

A different weight for every learning signal

Compare uniform OPD with RAD. Move the slider, inspect a token, or walk through one training iteration.

RAD takes a temporary optimizer step, scores token supervision by its effect on post-update reward, and commits an update with projected token weights.

For the illustrated zero-origin setting: wt = clip(γIt, −1, +1).

The temporary update is discarded. The real update starts from the original student parameters and optimizer state.

Results

Comparisons use 102,400 generated training responses, including RAD’s meta responses. RAD uses 100 updates; baselines and RAD-Simple use 200.

Competition math

Mean accuracy across six benchmarks: AIME24, AIME25, AIME26, HMMT2025-Feb, HMMT2025-Nov, and OlympiadBench.

16 responses / problem

RAD and RAD-Simple outperform all compared baselines on the six-benchmark mean for both students.

Competition math accuracy (%)
Method AIME24 AIME25 AIME26 HMMT2025-Feb HMMT2025-Nov OlympiadBench Mean
Teacher 74.79 ± 3.72 61.46 ± 3.53 74.79 ± 4.56 43.75 ± 5.38 59.17 ± 5.59 77.15 ± 0.52 65.18 ± 1.66
Student: Qwen3-1.7B (non-thinking)
Base 12.08 ± 3.89 11.04 ± 4.20 8.13 ± 2.63 6.04 ± 3.38 3.75 ± 2.00 39.30 ± 0.82 13.39 ± 1.49
GRPO 29.58 ± 5.64 19.58 ± 3.89 18.96 ± 5.98 15.63 ± 2.82 10.21 ± 4.93 53.07 ± 0.93 24.51 ± 1.46
OPD 40.00 ± 5.65 27.29 ± 4.44 26.46 ± 5.83 17.71 ± 3.67 16.67 ± 6.24 58.19 ± 1.17 31.05 ± 2.01
TIP 39.17 ± 4.93 28.54 ± 4.40 31.04 ± 5.98 17.08 ± 3.09 18.33 ± 4.08 57.93 ± 1.18 32.02 ± 1.70
RLAD 35.21 ± 4.08 27.71 ± 4.20 26.04 ± 6.89 16.88 ± 3.43 17.08 ± 4.55 58.06 ± 1.27 30.16 ± 1.58
ExOPD 36.88 ± 4.33 31.67 ± 4.08 31.25 ± 5.51 16.67 ± 2.89 19.38 ± 5.43 59.69 ± 1.12 32.59 ± 1.81
RAD 47.50 ± 7.41 36.04 ± 3.58 38.96 ± 3.86 22.50 ± 4.17 24.79 ± 4.08 64.60 ± 1.05 39.07 ± 1.59
RAD-Simple 46.88 ± 5.83 34.58 ± 5.64 38.54 ± 5.27 21.67 ± 3.54 24.38 ± 3.05 64.47 ± 1.07 38.42 ± 1.70
RAD family gain +7.50 +4.38 +7.71 +4.79 +5.42 +4.92 +6.48
Student: Qwen3-4B-Instruct-2507
Base 64.17 ± 5.95 48.33 ± 5.53 53.13 ± 5.46 32.29 ± 4.52 44.58 ± 4.06 71.77 ± 0.96 52.38 ± 1.47
GRPO 67.92 ± 6.44 55.63 ± 3.67 62.29 ± 4.52 34.58 ± 3.51 48.75 ± 5.38 74.58 ± 0.84 57.29 ± 1.72
OPD 65.21 ± 6.23 50.63 ± 4.60 55.42 ± 5.25 33.96 ± 3.95 41.46 ± 5.00 71.89 ± 0.74 53.09 ± 1.72
TIP 61.04 ± 4.82 49.79 ± 5.71 53.96 ± 6.79 33.96 ± 4.44 41.04 ± 6.09 71.77 ± 0.83 51.93 ± 1.85
RLAD 59.79 ± 5.06 47.71 ± 4.96 53.33 ± 6.12 32.29 ± 4.67 39.58 ± 5.64 72.50 ± 0.93 50.87 ± 1.60
ExOPD 58.13 ± 5.13 50.42 ± 3.51 55.21 ± 5.52 33.33 ± 4.08 40.63 ± 5.17 71.26 ± 0.92 51.49 ± 2.02
RAD 71.25 ± 5.51 62.50 ± 3.63 62.29 ± 5.23 36.04 ± 5.30 51.25 ± 5.12 75.46 ± 0.87 59.80 ± 2.07
RAD-Simple 71.88 ± 5.13 60.63 ± 3.77 63.96 ± 5.17 40.00 ± 4.41 52.29 ± 5.36 76.30 ± 0.79 60.84 ± 1.50
RAD family gain +3.96 +6.88 +1.67 +5.42 +3.54 +1.71 +3.55

Accuracy (%), mean ± SD. Mean averages six benchmarks. Bold marks the best trained score; underlining marks the second-best, including ties. RAD family gain compares the higher RAD or RAD-Simple score with the best baseline (pp).
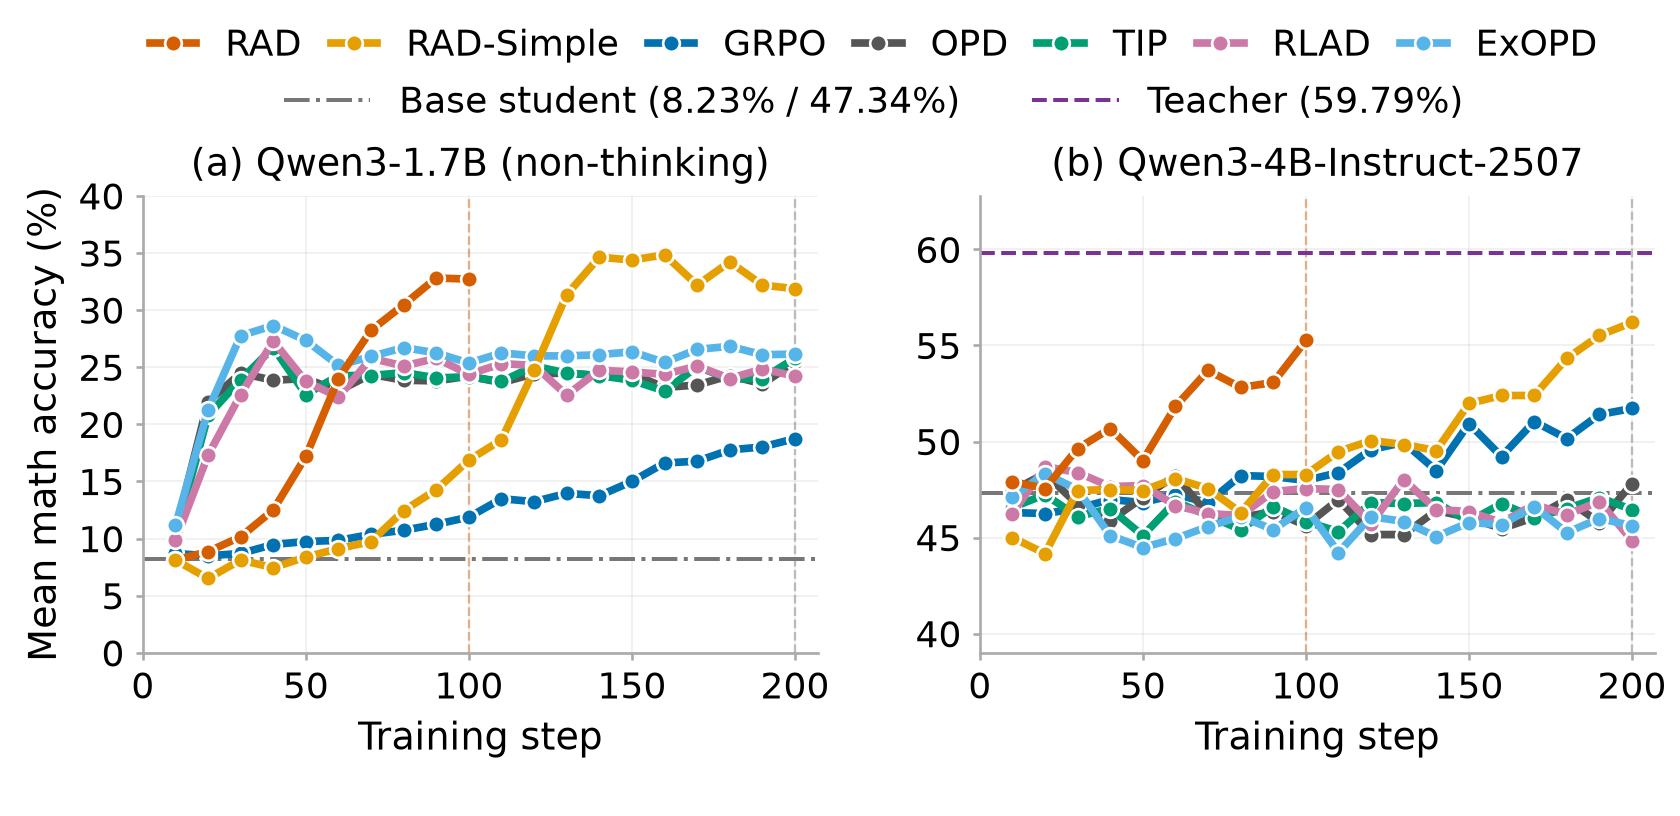
Learning dynamics

Learning progress for RAD, RAD-Simple, and the compared methods.

Four-benchmark math learning curves comparing RAD, RAD-Simple, and baselines for Qwen3-1.7B (non-thinking) and Qwen3-4B-Instruct-2507.
These curves average AIME24/25 and HMMT2025-Feb/Nov: four benchmarks. The main math table averages six. Checkpoints are shown as reported in the paper.

Code generation

LiveCodeBench-v6 pass@1 across 1,055 programming tasks: 322 easy, 383 medium, and 350 hard.

4 responses / task

RAD outperforms all compared baselines across easy, medium, and hard tasks for both students.

LiveCodeBench-v6 pass@1 (%)
Method Easy (322) Medium (383) Hard (350) Overall (1,055)
Student: Qwen3-1.7B (non-thinking)
Teacher 96.27 ± 0.79 69.71 ± 1.21 26.07 ± 0.24 63.34 ± 0.38
Base (student) 60.02 ± 1.17 16.45 ± 0.26 1.79 ± 0.71 24.88 ± 0.35
GRPO 66.07 ± 2.64 23.11 ± 1.13 4.07 ± 0.47 29.91 ± 1.14
OPD 81.37 ± 1.54 41.38 ± 1.40 10.79 ± 1.02 43.44 ± 0.70
TIP 82.69 ± 1.08 40.34 ± 2.16 9.71 ± 0.90 43.10 ± 0.52
RLAD 85.56 ± 1.55 44.58 ± 1.24 11.07 ± 0.62 45.97 ± 0.26
ExOPD 78.88 ± 0.58 32.96 ± 1.93 6.29 ± 0.70 38.13 ± 0.52
RAD 88.90 ± 0.40 57.11 ± 1.26 20.57 ± 0.35 54.69 ± 0.31
RAD gain +3.34 +12.53 +9.50 +8.72
Student: OLMo3-7B-Instruct
Teacher 89.36 ± 1.41 64.23 ± 1.86 28.86 ± 0.97 60.17 ± 0.98
Base (student) 76.09 ± 1.58 43.41 ± 2.31 14.86 ± 1.73 43.91 ± 1.50
GRPO 84.55 ± 0.89 54.11 ± 1.49 20.57 ± 0.73 52.27 ± 0.26
OPD 69.25 ± 3.10 48.69 ± 1.17 18.43 ± 1.77 44.93 ± 1.36
TIP 53.49 ± 0.83 40.86 ± 1.30 16.79 ± 1.02 36.73 ± 0.37
RLAD 84.70 ± 2.30 53.92 ± 0.54 16.57 ± 0.70 50.92 ± 0.91
RAD 89.67 ± 1.86 63.51 ± 0.34 24.86 ± 1.50 58.67 ± 0.52
RAD gain +4.97 +9.40 +4.29 +6.40

Pass@1 (%), mean ± SD. Bold marks the best trained score; underlining marks the second-best, including ties. RAD gain compares RAD with the best baseline (pp).

Evaluation protocol

Temperature 1, top-p 1, and a 32,768-token generation limit. Math uses 16 responses per problem and Math-Verify. Coding uses four responses per task, native LiveCodeBench grading, the training-question prompt format, and public starter code.

BibTeX

@misc{chen2026rewardaligneddistillation,
  title         = {Reward-Aligned Distillation},
  author        = {Yilan Chen and Zian Su and Manish Prajapat and
                   Dingmin Wang and Rui Song and Rein Houthooft and Vijay Lingam},
  year          = {2026},
  eprint        = {2610.14572},
  archivePrefix = {arXiv},
  primaryClass  = {cs.LG},
  url           = {https://arxiv.org/abs/2610.14572}
}